Energy Statistics India 2026
Created: 31 March 2026
Table of Contents
The Energy Statistics India 2026 report, released by the National Statistics Office (NSO) under the Ministry of Statistics and Programme Implementation, provides a comprehensive overview of India’s energy sector.
This is a very important current affairs topic for APPSC, Group 1, Group 2, SI, DSC, and TET exams, especially for questions related to economy, environment, and energy resources.
What is Energy Statistics India 2026?
It is the annual publication released by the National Statistical Office (NSO), under the Ministry of Statistics and Programme Implementation (MoSPI). The current edition is the 33rd edition. This report covers Energy reserves, production & consumption, Import & Export, Energy balance tables etc.
Key Improvements in 2026 Report
- This year ‘credit flow to energy sector’ and ‘global energy statistics’ was added.
- Covered:
- Domestic coal consumption (e-auction)
- Imported non-coking coal
- Industry-wise electricity consumption
- First-time inclusion:
- Aviation & marine bunker energy data
- Standardization of end-use consumption sectors
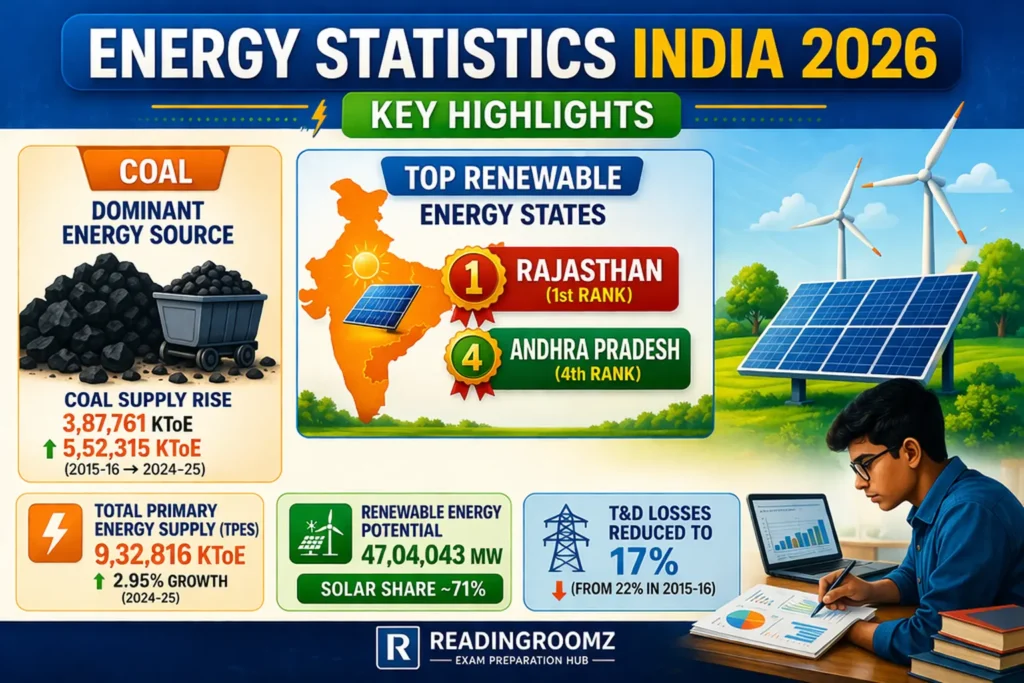
Key Highlights of Energy Statistics India 2026
Total Primary Energy Supply (TPES)
| Indicator | Value |
|---|---|
| TPES (2024-25) | 9,32,816 KToE (kilotonne of oil equivalent) |
| Growth Rate | 2.95% |
Renewable Energy Potential
| Source | Potential (MW) | Share |
|---|---|---|
| Solar | 33,43,378 MW | 71% |
| Wind | 11,63,856 MW | 25% |
| Large Hydro | 1,33,410 MW | 3% |
Total Renewable Potential: 47,04,043 MW
Top Renewable Energy States
| State | Share (%) |
|---|---|
| Rajasthan | 23.70% |
| Maharashtra | 14.26% |
| Gujarat | 9.10% |
| Andhra Pradesh | 9.10% |
| Karnataka | 8.59% |
| Madhya Pradesh | 8.09% |
These 6 states contribute 70%+ renewable potential.
Renewable Energy Growth
| Indicator | 2016 | 2025 |
|---|---|---|
| Installed Capacity | 90,134 MW | 2,29,346 MW |
| Electricity Generation | 1,89,314 GWh | 4,16,823 GWh |
Strong CAGR growth:
- Capacity growth rate 10.93%
- Generation growth rate 9.17%
Per Capita Energy Consumption
| Year | Value |
|---|---|
| 2015-16 | 15,296 MJ/person |
| 2024-25 | 18,096 MJ/person |
The daily food energy consumption for an average human is typically measured in megajoules (MJ) per person.
Transmission & Distribution Loss
| Year | Loss |
|---|---|
| 2015-16 | 22% |
| 2024-25 | 17% |
Energy Source
- Coal remains the largest contributor of energy source.
- Coal supply increased from 3,87,761 KToE to 5,52,315 KToE.
Total Final Consumption (TFC)
| Year | Value |
|---|---|
| 2015-16 | 4,69,212 KToE |
| 2024-25 | 6,08,578 KToE |
Credit Flow to Energy Sector
| Year | Credit |
|---|---|
| 2021 | ₹1,688 Cr |
| 2025 | ₹10,325 Cr |
Exam-Oriented Key Points
- Report released by NSO under MoSPI.
- 33rd edition.
- Coal is the largest energy source.
- Solar is the highest renewable share (~71%).
- Rajasthan ranked first, while Andhra Pradesh secured fourth place in renewable energy generation.
- Total primary energy supply (TPES) is 9,32,816 KToE (kilotonne of oil equivalent).
- Renewable capacity is 2.29 lakh MW.
FAQ – Energy Statistics India 2026
Who releases Energy Statistics India 2026?
The National Statistics Office (NSO) under MoSPI.
What is the latest edition of Energy Statistics India?
It is the 33rd edition.
Which energy source dominates India’s energy supply?
Coal is the dominant energy source.
Which renewable energy has highest share?
Solar energy (~71%).
Why is Energy Statistics India 2026 important for exams?
Because it covers:
Economy
Energy
Environment
Current Affairs
For Aspirants
You can expect at least one question from the Energy Statistics India 2026 report in competitive exams.
Focus on:
- Key numbers (TPES, capacity, consumption)
- Renewable energy trends
- Coal dominance
- Andhra Pradesh rank
Study with the ReadingRoomz Community
Join thousands of APPSC aspirants. Get daily current affairs, MCQs, PDFs, and preparation guidance — all in one place.